Extracting data from food sensitivity reports
A reference laboratory returns one report per panel, scoring a fixed list of foods for IgG antibody response. Every lab picks its own panel, its own codes and its own layout. Clinics receive them in a steady stream by portal download, secure email and fax, one per patient tested.
A clinician needs each food, its category and its reactivity level, plus the Total IgE result and whether it falls in range. Those populate the patient record and set the elimination diet the practice sends the patient home with.
What makes food sensitivity reports hard
The results are a picture
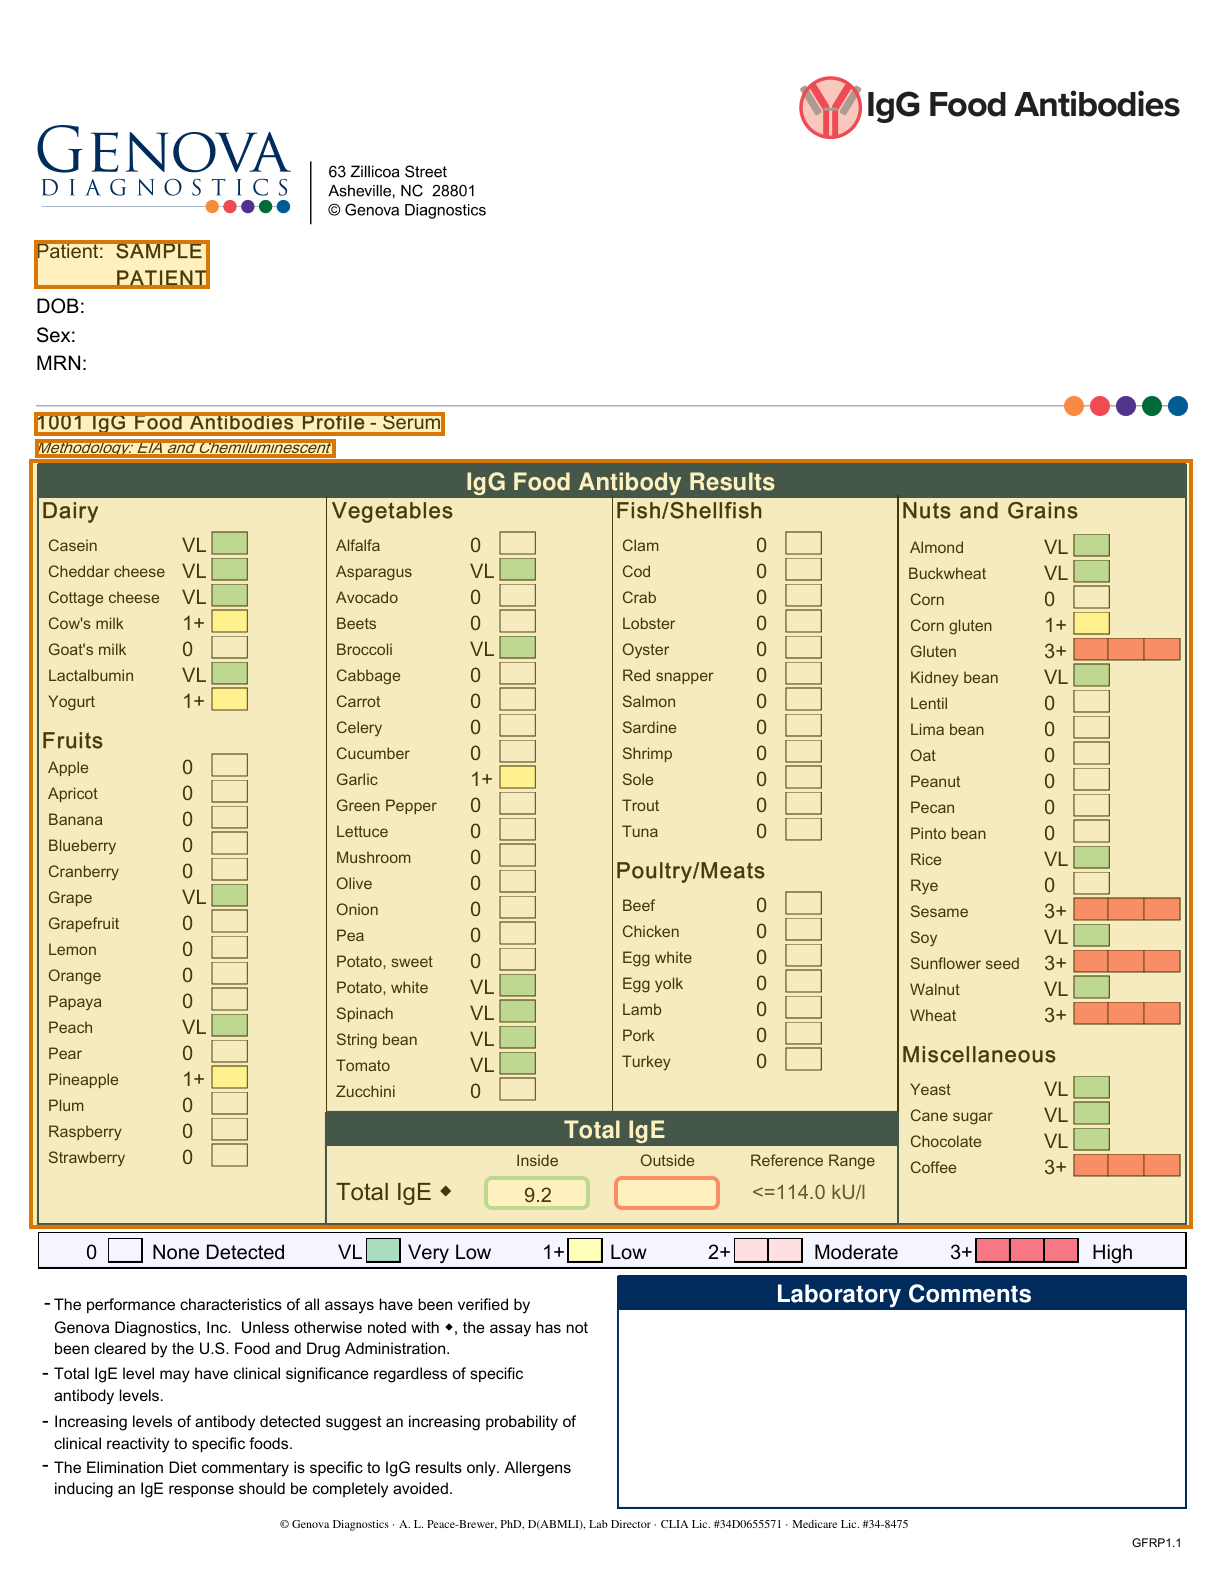
87 foods sit in four columns under category headings that break at different heights, with nothing ruled between the cells.
Color is a value
Each result is a code and a colored box, with a legend mapping five colors to five reactivity levels.
Panels change between laboratories
Each lab sets its own food list, its own reactivity scale and its own page design, so no two panels line up field for field.
Parse, extract, verify
Parse
Parse turns the document into reading-order Markdown and a hierarchy of blocks (text, tables, figures), and grounds each block to its exact location on the page.
Extract
You define the fields in a JSON schema, and Extract returns their values in a consistent, structured format, each linked back to where it appears in the Markdown.
Verify
Each value links back to where it appears, down to the character range in the Markdown, and the page and bounding box in the source document, so every result can be verified.
One food sensitivity report, end to end
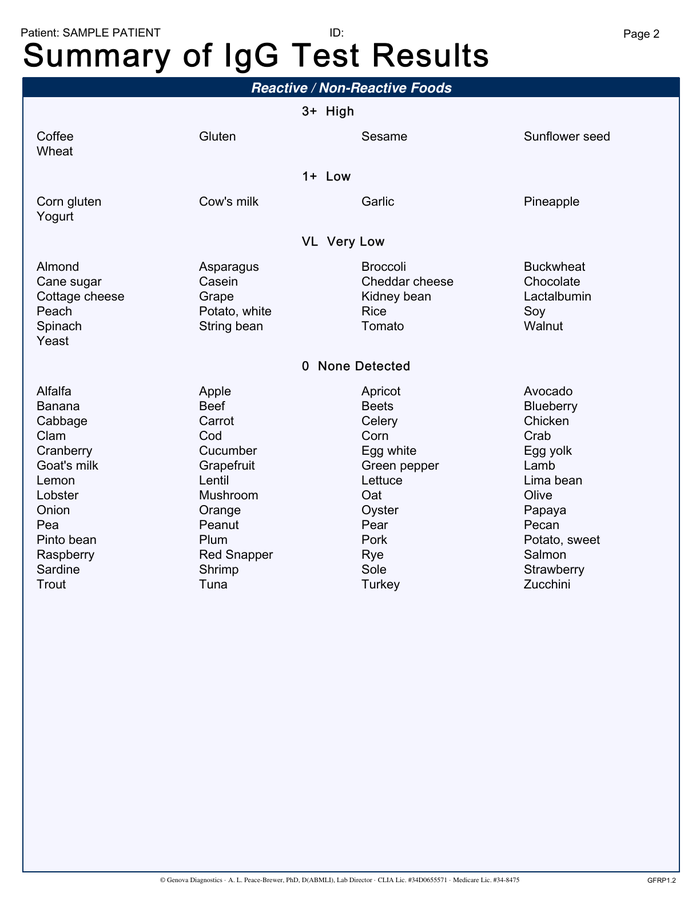
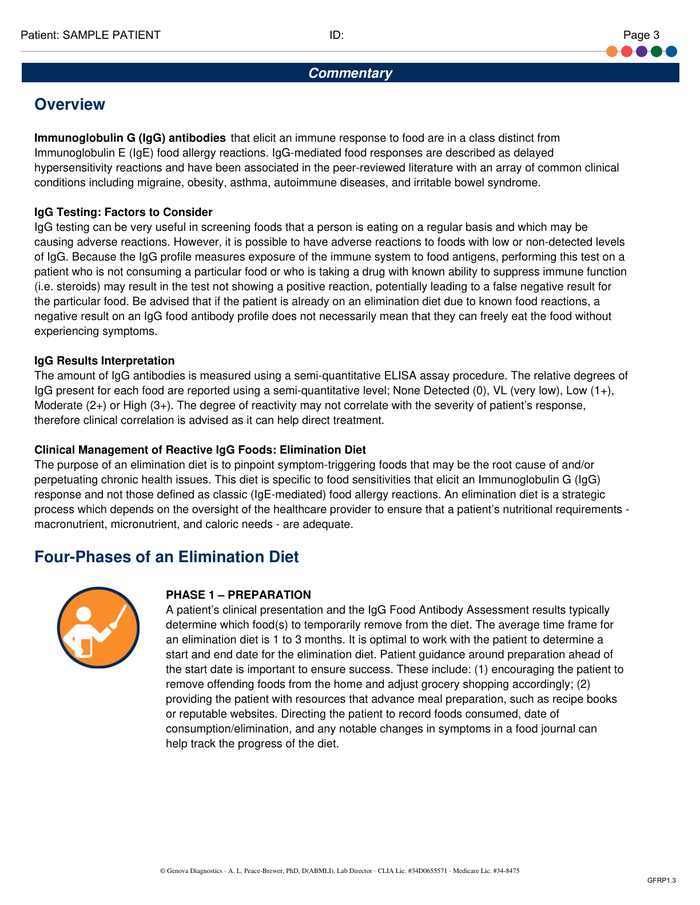
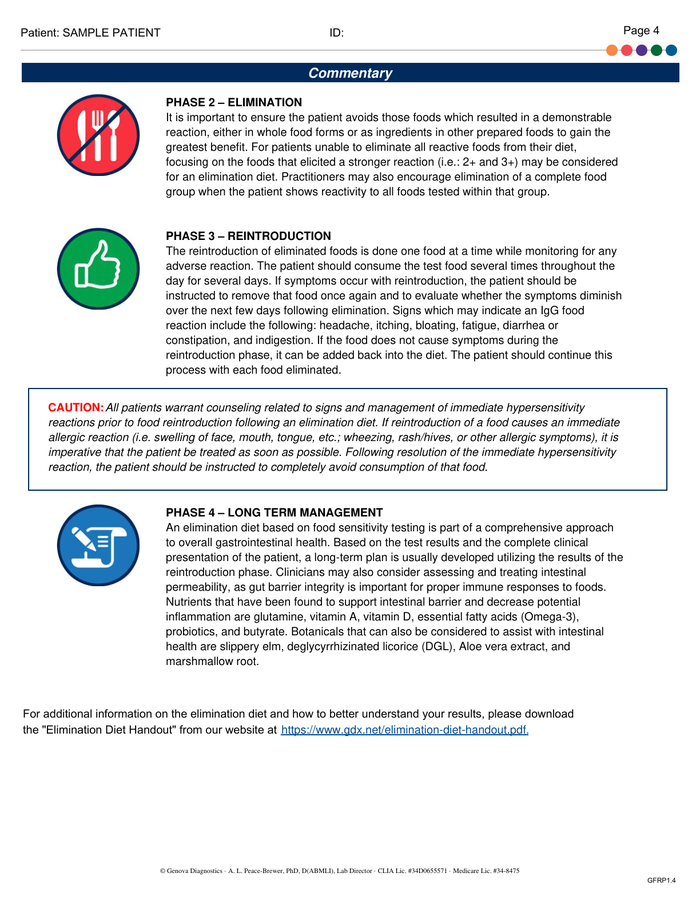
About this document: Genova Diagnostics' sample IgG Food Antibodies profile, published on gdx.net for clinicians. Four portrait pages. Page 1 is the results grid, 87 foods in seven categories with the Total IgE panel beneath it. Page 2 restates the same results grouped by level, and pages 3 and 4 are elimination diet guidance. The patient is the specimen SAMPLE PATIENT, with date of birth, sex and record numbers left blank.
Processing objective: The objective is to read the report header and one result out of the grid itself. Page 2 lists the high reactors as plain text and would have been the easier choice; page 1 is shown because a clinical system reading these at volume gets the grid.
Demonstration fields: Test profile, Methodology, Patient, Gluten result (from the results grid)
The document
4 of 4 pages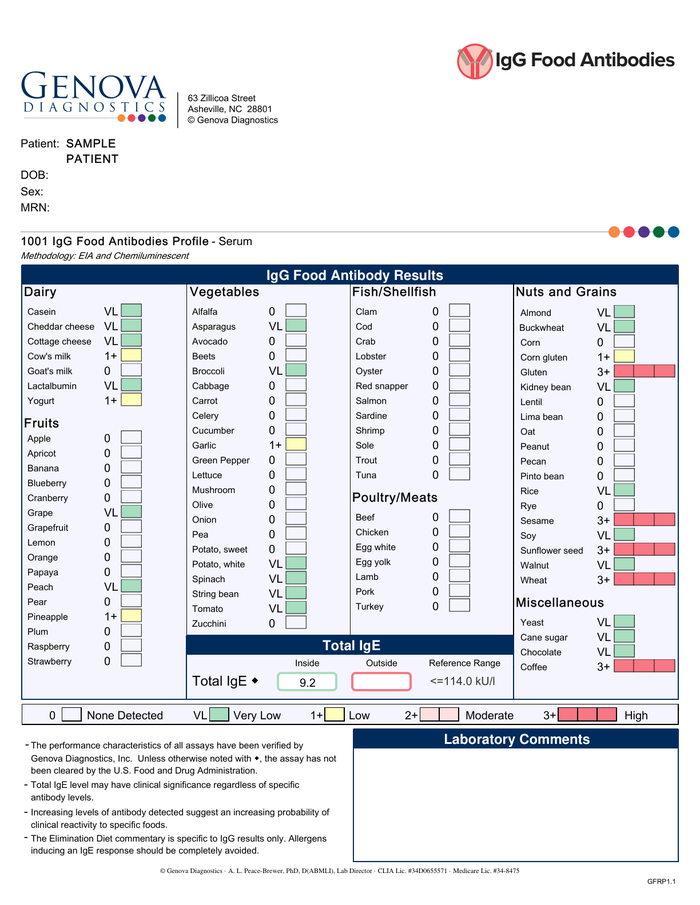 Page 1shown below
 Page 2
 Page 3
 Page 4
Where each value came from
report.test_name
{
  "value": "1001 IgG Food Antibodies Profile",
  "page": 1,
  "range": {
    "end": 216,
    "start": 176
  },
  "box": {
    "xmin": 0.02839,
    "ymin": 0.2602,
    "xmax": 0.36351,
    "ymax": 0.27465
  }
}report.methodology
{
  "value": "EIA and Chemiluminescent",
  "page": 1,
  "range": {
    "end": 256,
    "start": 217
  },
  "box": {
    "xmin": 0.02877,
    "ymin": 0.27737,
    "xmax": 0.27385,
    "ymax": 0.28894
  }
}report.patient_name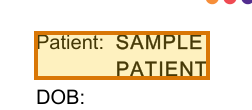
{
  "value": "SAMPLE PATIENT",
  "page": 1,
  "range": {
    "end": 159,
    "start": 136
  },
  "box": {
    "xmin": 0.02792,
    "ymin": 0.15208,
    "xmax": 0.17105,
    "ymax": 0.18185
  }
}food_results[68].result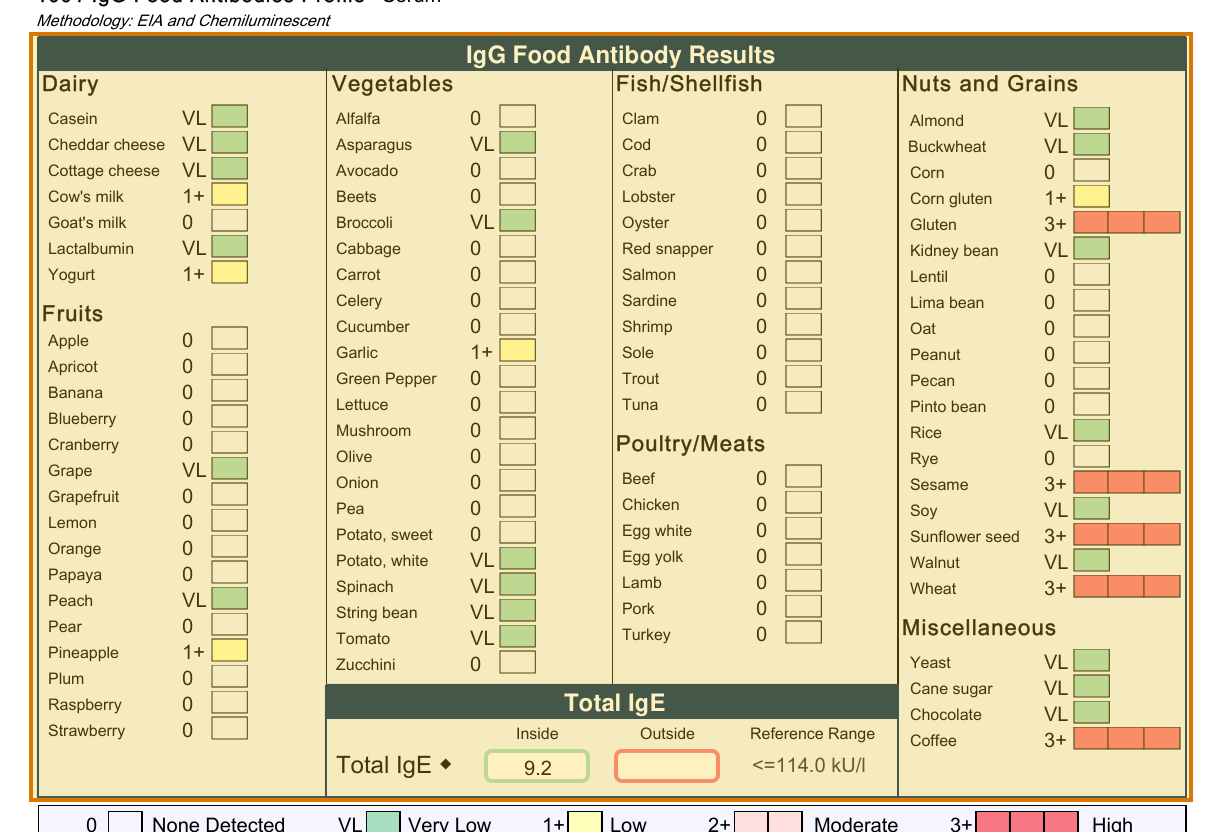
ADE’s range for this value covers Red, text beside it in the parse output.
{
  "value": "3+",
  "page": 1,
  "range": {
    "end": 5674,
    "start": 5671
  },
  "box": {
    "xmin": 0.02413,
    "ymin": 0.29007,
    "xmax": 0.97397,
    "ymax": 0.77535
  }
}
How to try it yourself
Everything on this page is reproducible. The sample, its schema, and the Parse and Extract API outputs are published. You can repeat the same two calls from whichever surface you already build on.
- Claude Skilldescribe the job; the agent writes it
- CLIno code at all
- MCPexpose ADE docs as an agent tool
- REST APIany language
- Pythonlandingai-ade
- TypeScriptlandingai-ade
Documents into data
Accurate
The best accuracy on the difficult documents other tools get wrong, such as messy scans, complicated tables, checkboxes and handwriting.
Auditable
Every answer cites its sources. Values come back with an audit trail (page, bounding box, character range) so a human can review them.
Agentic
Applies multi-step reasoning, and plans before it acts. Handles documents it has never seen before and adapts to variations.
API-first
Composable APIs that drop into any tech stack and can be called from anywhere. Easy to build on and embed in your pipelines and products.
Affordable
Cost-competitive rates with complete price transparency. Spend controls before you run, and every job reports its exact cost.
Enterprise-grade
Built for production and scale from day one. Fully observable and monitored, running securely in our cloud or yours.
Built for high-volume, high-throughput production
- Zero data retention
- Priority rate limits
- Enhanced support
- VPC and on-prem deployment
Available on Team and Enterprise plans.